OpenCV系列-3.图像平滑处理与阈值
AI-摘要
JinzAI GPT
AI初始化中...
介绍自己
生成本文简介
推荐相关文章
前往主页
前往tianli博客
1. 图像平滑处理
input image
18 | 54 | 51 | 239 | 244 | 188 |
55 | 121 | 75 | 78 | 95 | 88 |
35 | 244 | 204 | 113 | 109 | 211 |
3 | 154 | 104 | 235 | 25 | 130 |
15 | 253 | 225 | 159 | 78 | 233 |
68 | 85 | 180 | 214 | 245 | 0 |
如上input image为像素点,表中高亮部分为3x3的矩阵。
均值滤波:将上述3x3的矩阵累加后求平均值,赋值给矩阵
中值滤波:将上述3x3的矩阵顺序排列(min->max)后取中位数赋值给矩阵
高斯模糊:距离中间数值赋值不同的权重
import cv2
import matplotlib.pyplot as plt
import numpy as np

# 功能描述
if __name__ == '__main__':
    img = cv2.imread('opencvnoise.jpg')
    # 均值滤波
    blur = cv2.blur(img, (3, 3))  # 求均值
    # 方框滤波
    box = cv2.boxFilter(img, -1, (3, 3), normalize=True)  # 不常用
    # 高斯模糊
    gaussian = cv2.GaussianBlur(img, (3, 3), 1)  # 要满足高斯分布,所以更重视中间数值
    # 中值滤波
    median = cv2.medianBlur(img, 3)  # 取中间值(中位数)

    res = np.hstack((blur, gaussian, median))
    cv2.imshow('res', res)
    cv2.imwrite('opencvnoiseafter.jpg', res)
    cv2.waitKey(0)
    cv2.destroyAllWindows()


以上左一为原图,剩下三张图片分别时经过均值滤波、高斯模糊和中值滤波处理的图片,可以发现中值滤波在处理噪点时优势最为明显。
2. 图像阈值(threshold)
ret, dst = cv2.threshold(src, thresh, maxval, type)
ret:阈值化操作返回值,成功(0)或失败(1)
dst:输出图
src:源图
thresh:阈值
maxval:当超出阈值时赋予的值(由type来决定)
type:二值化操作的类型(共有5中类型,下文详述)
2.1 type二值化操作的5种类型
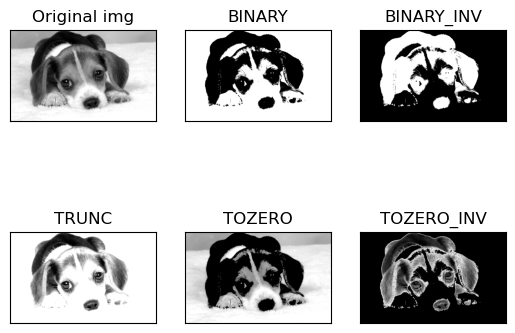
THRESH_BINARY:超过阈值部分设为maxval,否则设为0
THRESH_BINARY_INV:THRESH_BINARY的反转
THRESH_TRUNC:大于阈值部分设为阈值,否则不变
THRESH_TOZERO:大于阈值部分不变,否则设为0
THRESH_TOZERO_INV:THRESH_TOZERO的反转
import cv2
import matplotlib.pyplot as plt
import numpy as np

img_grey = cv2.imread('dog.jpg', cv2.IMREAD_GRAYSCALE)
ret1, thresh1 = cv2.threshold(img_grey, 127, 255, cv2.THRESH_BINARY)
ret2, thresh2 = cv2.threshold(img_grey, 127, 255, cv2.THRESH_BINARY_INV)
ret3, thresh3 = cv2.threshold(img_grey, 127, 255, cv2.THRESH_TRUNC)
ret4, thresh4 = cv2.threshold(img_grey, 127, 255, cv2.THRESH_TOZERO)
ret5, thresh5 = cv2.threshold(img_grey, 127, 255, cv2.THRESH_TOZERO_INV)

imgs = [img_grey, thresh1, thresh2, thresh3, thresh4, thresh5]
titles = ['Original img', 'BINARY', 'BINARY_INV', 'TRUNC', 'TOZERO', 'TOZERO_INV']

for i in range(6):
    plt.subplot(2, 3, i + 1)
    plt.imshow(imgs[i], 'gray')
    plt.title(titles[i])
    plt.xticks([])
    plt.yticks([])
plt.show()
本文是原创文章,采用 CC BY-NC-ND 4.0 协议,完整转载请注明来自 Jinz
评论
匿名评论
隐私政策
你无需删除空行,直接评论以获取最佳展示效果


